


Are EVs Better on Emissions? — Comparative Calculations
It isn’t always easy to tell, but here’s how to find out

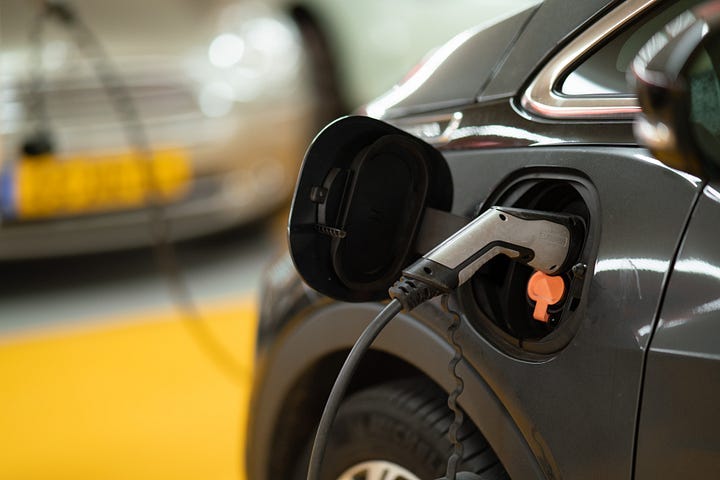
Photo by Michael Fousert on Unsplash
NOTE: I recently published this article on Medium because it was a response to a Medium comment. To my surprise, thousands of people read it, so I am sending it to Carbon 350 Readers as well. The spreadsheet mentioned at the end is still in the works.
In a recent article in The New Climate published on Medium, a comment by Mark Krauss asked three questions aimed at determining if EVs are really better or not when it comes to carbon. I’m going to try to answer his questions here. But first, here are the questions from @mark.krauss21 in his own words:
As objectively as you can be, please, I would like to know the following;
1). What is the carbon footprint of a mid-size gasoline vehicle that averages 25 miles per gallon and is driven 15,000 miles per year in ppm?
2) What is the carbon footprint of an equivalent-sized electric vehicle driven 15,000 miles per year based on the daily charge rate required in kilowatt-hours converted to ppm produced by the most commonly used type of power plant?
If the ppm value is too coarse for the measurement, please use the finer version of the same measurement. I am not familiar with ppm or its meaning.
3) What is today’s most commonly used method to produce electric power for our grids?
I’m grateful for questions like this because they motivate learning and research. Here’s what I found.
Terminology and Measures
First, let’s get the terminology right because it can be confusing. Ppm is “parts per million” and is a measure of the concentration of carbon in the atmosphere. The higher the number, the worse our situation has become regarding climate change. Pre-industrial carbon levels were at about 280 ppm; today we are near 420 ppm. That difference is why we have climate change. The carbon acts like glass in a greenhouse by reflecting and holding the heat. Everything warms up, and the climate changes. More importantly to Mark’s question, ppm is not a measure that can be assigned to a car, a plane, or a power plant. It is a measure of total carbon in the atmosphere.
Instead of ppm, therefore, we measure the carbon coming out of the tailpipe of a car or a smokestack by weight. That is a relatively easy measure to obtain.
Carbon Footprint of Operating a Gasoline Vehicle (ICE)
So, how much carbon comes from a traditional car? The consensus is reported succinctly by shrinkthatfootprint.com,
“Fuel combustion emissions can be calculated from an actual fuel economy, as we know around 8.8 kg CO2e is produced using each US gallon of fuel. So if you know your car averages 25 MPG then you can divide 8.8 by 25 to give 351 g CO2e/mile for fuel combustion emissions.”
CO2 is produced at 8,800 g (8.8 kg) per gallon of gasoline burned. So, if the internal combustion engine (ICE) vehicle gets 25 mpg, the car generates 351 g CO2/mile. If you drive 15,000 miles in a year, multiply 15,000 by 351 g/mile to get 5,280,000 g CO2 (5,280 kgCO2).
However, there is another part to the story. The gasoline burned in the ICE car has an additional carbon cost when it is refined from crude oil into gasoline. This carbon cost, which is emitted at the refinery, has been calculated at 1,112 g CO2 per gallon of gasoline. If you divide 1,112g CO2 by 25 miles per gallon and we get an additional emission calculation of 44.5 g CO2 per mile. Based on 15,000 miles, you have to add another 667,200 g CO2 for a total of 5,947,200 g CO2 (5,947.2 kg CO2) for the ICE vehicle.
So, to answer Mark’s first question directly, the total operating emissions for an ICE vehicle driving 15,000 miles is 5,947,200 g CO2 (5,947.2 kg CO2).
Carbon Footprint of an Equivalent EV
EVs have no tailpipe emissions at all. Whether one drives 15 miles or 15,000 miles, it doesn’t matter. There will be no tailpipe emission. EVs don’t have tailpipes.
But this is deceiving. People are quick to point out that while the EV does not emit carbon, much of the electricity used to power the EV may come from power plants that burn coal or natural gas, both of which produce carbon emissions. They are right about this. So we will have to calculate that.
To do so, we can start with how many kwh of electricity are needed to drive a mile. Just as mpg efficiency is different from one ICE vehicle to another, the same is true for EVs. One source put the average as 0.346 kwh per mile using 2020–2022 models and data. But a quick glance at this chart shows that the range can be from 0.24 kwh/mile to 0.87 kwh/mile — either 50% less than the average or as much as 150% more. The type of EV you buy has a big impact on vehicle CO2 emissions because it changes the amount of electricity (kwh) needed to run the vehicle. For Mark’s question, we will use the average, but keep in mind that any specific answer could vary widely from one situation to the next. For this example, we will use the average of 0.346 kwh per mile.
The other question is this: What is the mix of electricity sources you are using? This is a critical input because the source of the electricity can have a dramatic effect on carbon output.
The website reneweconomy.com.au spells it out:
“The carbon intensity of electricity varies greatly depending on the fuel source.
“As a rough guide coal has a carbon intensity of about 1,000g CO2/kWh, oil is 800g CO2/kWh, natural gas is around 500g CO2/kWh, while nuclear, hydro, wind, and solar are all less than 50 g CO2/kWh.”
In other words, fossil fuels for electricity emit ten to twenty times more emissions than nuclear and renewables. The source of the electricity makes an enormous difference. Let’s calculate how large that difference is.
The extremes are 100% coal versus 100% renewable. Most people only get 100% renewable if they are producing their own power from rooftop solar or have subscribed all of their energy to a community solar or community wind project. If your electricity comes from the grid, it is most likely a mix.
This gets at Mark’s questions regarding the fuel sources for electricity. Again, we will need to use averages to define the source of power for the electric grid. The US Energy Information Administration says this:
“In 2022, about 4,243 billion kilowatt-hours (kWh) (or about 4.24 trillion kWh) of electricity were generated at utility-scale electricity generation facilities in the United States.1 About 60% of this electricity generation was from fossil fuels — coal, natural gas, petroleum, and other gases. About 18% was from nuclear energy, and about 22% was from renewable energy sources.”
These numbers are averages, and the range is large. This chart from Wikipedia shows that the percentage of renewable electricity varies by state from 99.7% renewable sources in Vermont to 3.2% renewable sources in Delaware. Hence, the answer to Mark’s third question is extremely dependent on where you live and where the energy on your grid comes from. It is an important question because it affects the answers to his questions about EVs.
So what is the carbon footprint of an EV traveling 15,000 miles? Let’s calculate it.
If the EV has an average efficiency of 0.346 kwh/mile, we multiply that by 15,000 miles to show that the EV needs 5,250 kwh of electricity to drive that far.
If we then use the USEIA average of 60% of electricity from fossil fuels (40% coal and 20% natural gas) plus 40% from non-burning sources (renewables and nuclear), we can assign each source of kwh an appropriate carbon level based on the source. The calculations would look like this
The 40% from Coal
Forty percent of the 5,250 kwh needed is 2,100 kwh. Each kwh produces 1,000 g CO2. So the coal-sourced electricity to drive that far produces 2,100,000 g CO2 (2,100 kg CO2).
The 20% from Natural Gas
Twenty percent of the 5,250 kwh needed is 1,050 kwh. Each kwh produces 500 g CO2. So the natural gas-sourced electricity to drive that far produces 525,000 g CO2 (525 kg CO2).
The 40% from Non-Burning Sources
Forty percent of the 5,250 kwh needed is 2,100 kwh. Each kwh produces 50 g CO2. So the non-burning-sourced electricity to drive that far produces 105,000 g CO2 (105 kg CO2).
Total Emissions for EV
The total emission then is the total of these figures: 2,100,000 g CO2 + 525,000 g CO2 + 105,000 g CO2 = 2,730,000 g CO2 (or 2,730 kg CO2).
Comparison of Operating Emissions from EVs to ICE Vehicles
Based on these calculations, the ICE vehicle emits 5,947,200 g CO2 for the 15,000 miles traveled, whereas the EV emits 2,730,000 g CO2 — a difference of 3,217,200 g CO2, or a 54% reduction by driving the EV.
This comparison does not mean, however, that all EVs are always better. We said earlier that EV efficiency may be as poor as 0.87 kwh/mile. Given the mix of electric sources in this example above, an efficiency level of 0.76 kwh/mile effective zeroes out all gains in carbon emissions. Such an EV and the ICE in the example would operate at essentially the same level of carbon output.
In another example, if we keep the efficiency of the EV at average (0.346 kwh/mile) and assume that all the electricity to charge it comes from coal, the EV produces 5,190,000 g CO2 and therefore saves only 757,200 g CO2 over the ICE vehicle — a mere 13% savings. Hence, if all your electricity comes from coal, a vehicle with efficiency rated at 0.40 kwh/mile zeroes out any gains in emissions, and anything over that is actually producing more emissions than the ICE vehicle in this example.
These examples and comparisons illustrate that EVs can produce enormous savings in carbon emissions over ICE vehicles, but they also show that efficiency and electricity sources have a huge impact on whether or not that potential is met. The only way to answer Mark’s question is with a specific calculation for a specific situation that accounts for EV efficiency and electricity sources.
Is this answering your questions? Know someone thinking about EVs? Share this article!
Carbon Cost for Building the Vehicles
Critics are always quick to point out that these are only operating emissions, and to get to the actual carbon footprint Mark is asking about, you have to look at what it takes to build the car. This, however, is where it gets extremely murky.
For ICE vehicles, several items must be considered. There are the remaining emissions (beyond refining) from producing gasoline — petroleum exploration and discovery, production (pumping), shipping, and then distribution to customers. There are also emissions from the factory that assembles the cars, the steel, the parts, the plastic in the parts, the glass, etc. All of these have some impact on carbon footprint, and their actual level depends on the efficiency of the supplier and whether or not they are using clean energy and/or mitigating carbon by capture. When you think about assigning a portion of each of these to a product, it makes one’s head spin. Mike Berners-Lee who wrote the quintessential effort to define and measure carbon footprint, How Bad Are Bananas?, essentially threw his arms up in the air: “The carbon footprint, as I have defined it, is the climate change metric that we need to be looking at. The problem is that it is also impossible to measure.”
The same problem haunts EVs. Part of the upstream carbon is the same — there are various assembly factories and part production factories, similar to what exists for ICE vehicles. Instead of oil refining and distribution, however, the EV carbon footprint must include the battery production process, as well as obtaining and refining materials such as cobalt and lithium. The carbon impacts of batteries always increase the carbon footprint of EV manufacturing, but I have not seen the upstream inputs from oil production included for the carbon footprint of ICE vehicles. Nonetheless, the general consensus is that EVs are more carbon-intensive to build than ICEs due to the carbon cost of battery production. While calculating a specific number is impossible, as Berners-Lee admits, the consensus holds.
EVs, however, have an advantage — they can make up the difference. As one battery-related site put it: “However, the initial CO2 footprint associated with EV production is dwarfed when compared to the operational CO2 footprint of ICE vehicles. The initial carbon deficit from manufacturing only takes several thousand vehicle-miles/year of ownership to overcome and depending on how “green” your energy grid is, EV carbon parity with ICE vehicles can be reached as quickly as six months.”
EVs have one other huge advantage — they can get better. Battery technology is likely to go beyond lithium and cobalt as new research discoveries are made and new promising technologies come online. As they do, the carbon footprint of EV production will shrink significantly. There won’t be any improvement in the ICE supply chain that isn’t also available to EVs.
Here’s the kicker. Just as an EV’s operating emissions depend on the source of electricity used for charging the battery, so does the calculation of production emissions for both ICEs and EVs, so the calculation of carbon footprint could be off by as much as twentyfold. Shipping, refining, mining, oil production, and much more in the process require energy, and the source of that energy greatly affects the total carbon footprint.
For this reason, any listing of the so-called carbon footprint for an ICE vehicle or EV is highly questionable. Inherently, such an estimate requires assumptions to be made. Not only might those assumptions reflect bias, but they could also be wrong or very easily change, especially as the energy input mix changes. Consumers have no way of knowing. The best estimates are that within six months to two years, any difference in carbon emitted from the production of the vehicle is made up for in its operation. Once you hit that point, you are rapidly contributing to a reduction in overall CO2 for a given amount of driving.
The Upshot
The way I look at it is this. The idea of calculating the entire carbon footprint of a product, especially one so complex as an automobile, is a meaningless exercise. EVs and ICEs are roughly similar in terms of the carbon emitted in building them, and in any case, reach parity after only a short time driving the EV. From then on, the EV is responsible for comparatively less carbon, and quite possibly significantly less carbon.
For operating the vehicles, as we have seen, EVs have the advantage, Even if all the electricity to charge them comes from coal — they are about 15% better. As the electricity to charge them is renewably sourced, however, the EV number drops precipitously and can exceed a 95% reduction in emitted carbon. Our best chance to solve climate change is to get our energy from non-burning sources and use it intelligently. Even if your new EV is today drawing most of its recharge from coal-based electricity, you are still improving carbon emissions, and as your utility converts to non-burning sources, your impact will increase. So on an individual level, too, it is best to get an EV.
Hopefully, I have answered Mark’s questions. I’ll be glad to see yours.
Anthony Signorelli
PS: I am finishing an Excel spreadsheet that automates these calculations, as well as the cost comparisons. Watch for it soon!
Thanks for interesting piece. One point I like to consider - if all the population of my city (let's say 1 million) were to drive EVs - but the source of electricity was entirely from a coal plant, WE'D STILL BE AHEAD OF THE GAME BECAUSE THE CITY WOULD JUST NEED TO CHANGE ONE THING - the source.
Changing one million people and their mode of transporation is a lot harder than changing a city's electricity source.